The first example they presented was the Guardian’s take on government spending. The Initially this information is ‘hidden’ in several pdf’s with long columns of digits. The Guardian dug into that and made an interactive graph showing intuitively where the money goes. Readers were then invited to propose the budget cuts they thought the government should make. This was inmediately turned into a graph they could share, attracting more interest and discussion.
Mariana lives in Hackney, where the London riots took place, and in those days was relieved to get home safely. She barred her door, but took photos through her window and sent them on, like many other people did. Back at the Guardian office the tweets were collected and curated, and mapped what was happening where, real time. After three days this map was translated into print. And a book was made in cooperation with the London School of Economics and the Open Society Foundations. They had interviews with 600 people, among which 270 rioters and 130 police officers. An enormous heap of 2.6 million tweets was analyzed. Online, along a timeline the amount of tweets and retweets and their character was shown in families of circles in red yellow and green, growing and moving like a natural organism.The Guardian uses local blogs for travel information of a foreign city, but also asks around in tweets. In print this turns out in a map with some highlights where to go, where to eat, where to stay, etc. Online the map shows the spots and by mouseover you get more info with photos or even movies, making it a lively city guide.
A special example of the difference between online and print was the use of an infographic of the Syrian armed forces. First it was embedded in a large article in print. But only when it was shown online as a stand alone it was really noticed and quickly retweeted 700 times.

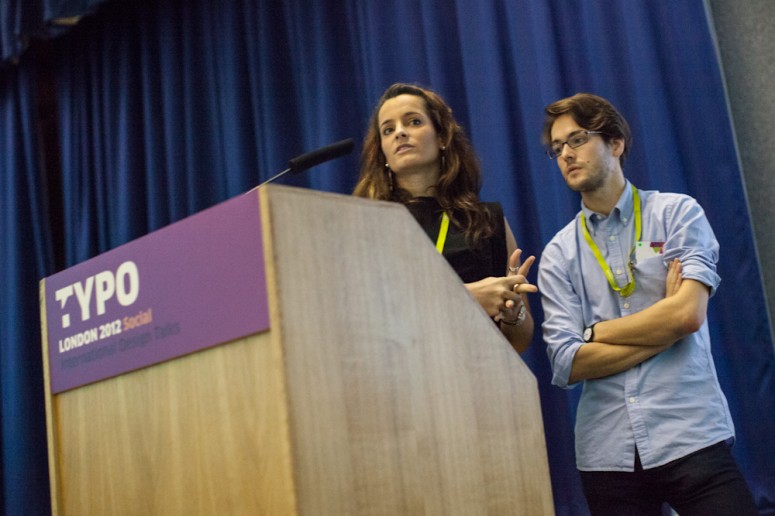
Mariana Santos & Mark McCormick (The Guardian)
By Titia Schoenaker


 Mariana Santos and Mark McCormick, photo © Jason Wen


